
Views: 0 Author: Site Editor Publish Time: 2026-09-22 Origin: Site


For industrial process engineers and plant managers, an unexpected filter breakthrough isn't just a minor maintenance issue. It represents a serious regulatory compliance failure, a potential safety hazard, and a direct cause of costly production downtime. When contaminant levels suddenly spike, the entire operation is placed at risk.
Laboratory data often provides baseline adsorption capacities under ideal, controlled conditions. However, real-world operational variables drastically alter the lifespan of granular activated carbon (GAC) beds. Changing flow rates, competitive adsorption, and shifting temperatures quickly compress predicted operational cycles. Relying solely on academic models often leaves operators exposed to sudden effluent violations.
This guide bridges the gap between academic adsorption modeling and complex field-level realities. We provide a concrete framework to forecast bed exhaustion and establish highly reliable detection protocols. You will learn how to specify the correct media to maximize performance, extend operational lifecycles, and maintain continuous regulatory compliance.
The MTZ Dictates Exhaustion: Understanding the Mass Transfer Zone (MTZ) and your specific activated carbon breakthrough curve is critical for calculating safe change-out schedules before effluent limits are breached.
Predictive vs. Reactive: Combining predictive models (flow meter tracking, theoretical bed life calculations) with reactive detection (effluent sampling, continuous monitoring) offers the most robust defense against unexpected breakthroughs.
Media Specification Matters: Selecting application-specific media—such as PSD-A1 Coconut GAC for volatile organic compounds or specific Water Treatment Carbon grades—fundamentally alters the shape and predictability of your breakthrough curve.
Field Realities Supersede Lab Data: Real-world phenomena like channeling, bio-fouling, and competitive adsorption will compress predicted timelines, requiring conservative safety margins in change-out schedules.
Every adsorption process follows a predictable mathematical path. We map this path using an S-shaped graph. The x-axis tracks the elapsed time or cumulative volume treated. The y-axis measures the ratio of effluent concentration to influent concentration. Initially, the effluent registers zero contaminants. As the carbon absorbs molecules, the curve stays flat. Eventually, the curve slopes upward. This upward slope illustrates the decreasing efficiency of the media.
The Mass Transfer Zone (MTZ) is the active adsorption band inside your vessel. Imagine it as a distinct layer moving slowly from the top of the bed to the bottom. Above the MTZ, the carbon is completely saturated. Below the MTZ, the carbon remains untouched. All active removal happens exclusively within this moving zone.
Laboratory tests often produce a very narrow, sharp MTZ. In contrast, industrial scale-up introduces fluid dynamics challenges. Faster flow rates and larger vessel diameters stretch the MTZ. This kinetic limitation means your active adsorption band elongates over time. A longer MTZ reaches the bottom of the vessel much faster than theoretical models predict. You must account for this elongation when scaling up lab data.
Operators must distinguish between initial breakthrough and total exhaustion. Initial breakthrough occurs when contaminants first appear in the effluent at detectable limits. This is usually your regulatory compliance threshold. Total exhaustion occurs later. It happens when the carbon can absorb absolutely nothing else. At this stage, the influent concentration equals the effluent concentration. You must replace the media at initial breakthrough, long before total exhaustion happens.
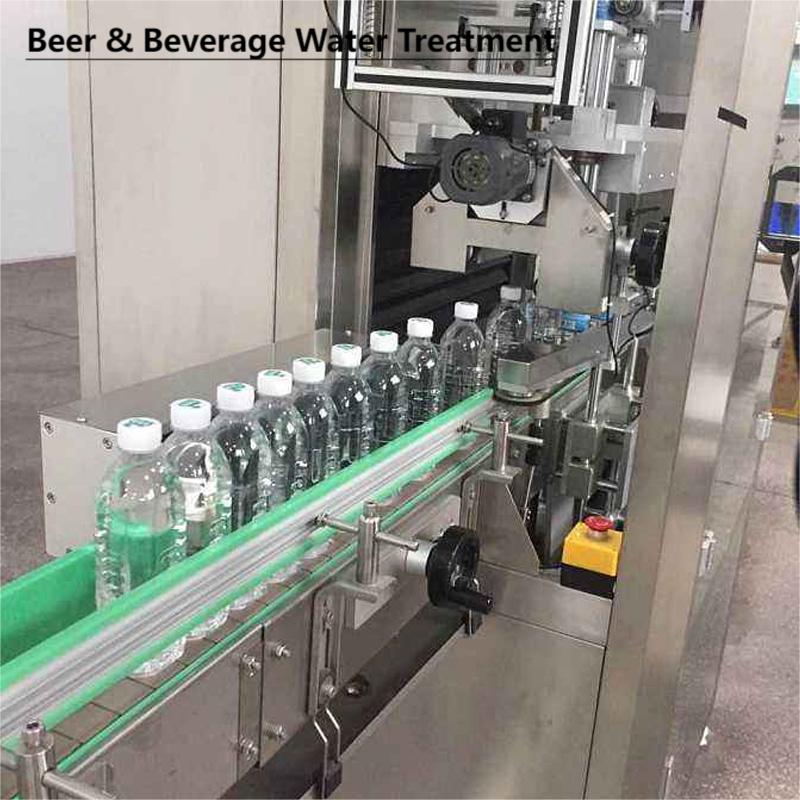
You cannot predict media lifespan without precise flow data. Modern industrial systems utilize totalizer flow meters. These devices track the cumulative fluid volume passing through the carbon bed. You cross-reference this volume against the calculated bed capacity. If a bed can treat one million gallons, the flow meter serves as your primary countdown timer. Consistent volumetric tracking removes the guesswork from maintenance scheduling.
Engineers rely on standard mathematical models to establish baseline chemical capacity. The Freundlich isotherm works well for heterogeneous carbon surfaces. The Langmuir isotherm assumes a single-layer molecule arrangement. Both models provide a baseline adsorption capacity measured in milligrams of contaminant per gram of carbon. They form the foundation of your predictive math.
Pure-component isotherm data is inherently optimistic. Industrial streams rarely contain just one contaminant. Your process fluid likely contains background organics, humic acids, and competing molecules. These background elements fight for space inside the carbon pores. They consume available capacity and accelerate saturation. You must adjust pure-component data downward to reflect this competitive adsorption in real-world mixtures.
Sudden flow surges and concentration spikes happen. Therefore, you should never run a filter bed to its absolute calculated limit. Implementing early-warning thresholds protects your process from compliance failures. Industry leaders plan change-outs at a fraction of the theoretical bed life.
The 80% Rule: Schedule media replacement when the bed reaches 80% of its calculated lifespan.
Buffer Accounting: Add an extra 10% safety margin if influent concentrations frequently fluctuate.
Surge Readiness: Keep standby vessels pre-loaded and ready for immediate deployment during sudden breakthrough events.
Your sampling frequency must match the physical characteristics of your media. A steep exhaustion curve demands highly frequent testing. Once breakthrough begins on a steep curve, compliance failure happens rapidly. A shallower curve allows for slightly longer intervals between grab samples. You must establish a rigid sampling schedule based on your historical operating data.
Automated monitoring provides a crucial layer of defense. Many plants deploy inline Total Organic Carbon (TOC) analyzers for liquid systems. Gas-phase systems utilize specific gas detectors. These sensors deliver real-time data to your control room. They alert operators the moment effluent quality begins to degrade.
However, automation is not flawless. Sensors suffer from baseline drift over time. They require rigorous, frequent calibration to remain accurate. Furthermore, a dangerous lag time often exists between initial sensor detection and actual regulatory failure. You must set alarm thresholds well below your compliance limits to account for this lag.
The most reliable defense against breakthrough is a lead-lag configuration. This setup places two identical carbon vessels in series. The primary vessel (lead) handles the heavy contaminant load. The secondary vessel (lag) serves as a polishing filter.
Sample Between Beds: Install a sample tap exactly between the lead and lag vessels.
Monitor the Lead: Draw daily samples from this interstage point.
Detect Safely: When the lead vessel breaks through, the lag vessel catches the contaminants.
Rotate Vessels: Replace the lead bed, then rotate the old lag bed into the primary position.
This method guarantees safe, zero-downtime operation.
Carbon is not a generic commodity. You must match the physical pore structure to the molecular size of your target contaminant. Iodine number indicates microporosity, which is excellent for capturing small, volatile molecules. Pore size distribution determines how well the carbon captures larger organic compounds. A mismatched pore structure dramatically shortens the MTZ and accelerates failure.
Choosing the precise grade of media shapes your predictive models. Municipal facilities and heavy industrial plants evaluating baseline requirements typically start with standard Water Treatment Carbon. This media offers a balanced pore structure suitable for bulk organic removal.
For more demanding liquid-phase applications, mechanical durability becomes critical. In high-flow environments, fragile carbon breaks down into fine dust. When durability is paramount, operators often specify LAC-P Granular Carbon or GAC-P S Granular Carbon. These specialized grades withstand aggressive backwashing and turbulent flow rates without sacrificing active surface area.
Trace volatile organic compounds (VOCs) present a different challenge. They require highly microporous structures to trap tiny molecules securely. For these scenarios, PSD-A1 Coconut GAC is the superior choice. Its dense micropore network traps VOCs aggressively. Using this specific media produces a much sharper, more predictable activated carbon breakthrough curve in specialized liquid or gas-phase applications.
Selecting media involves analyzing long-term performance metrics. Look beyond the initial purchase price.
Table 1: Carbon Media Evaluation Criteria
Evaluation Criterion | Description | Impact on Performance |
|---|---|---|
Cost per Volume Treated | Measures operational efficiency rather than simple cost per pound. | Identifies high-capacity carbons that reduce change-out frequency. |
Attrition Resistance | The ability of the granule to withstand physical friction and pressure. | Prevents bed compaction and reduces pressure drop issues over time. |
Reactivation Potential | Whether the spent media can be safely regenerated via thermal processes. | Improves overall sustainability and lifecycle resource utilization. |
Even perfect predictive models fail if the fluid bypasses the media entirely. Poor bed packing causes channeling. Fluid always seeks the path of least resistance. If the underdrain design is inadequate, water carves dedicated channels through the bed. The fluid rushes past the carbon without making contact. This short-circuiting renders your theoretical curves completely useless. Proper initial wetting and controlled backwashing prevent channeling.
Carbon beds are designed for adsorption, not physical filtration. Pumping high levels of suspended solids into the vessel blinds the media. The solids act like a physical wall, blocking the microscopic pore entrances. In wastewater applications, biological fouling presents a similar threat. Microbes form thick slime layers over the carbon granules. Robust pre-filtration is mandatory. Without it, you will experience severe pressure drops long before chemical exhaustion occurs.
Competitive displacement is the most dangerous field variable. Different molecules have different binding affinities. Weakly adsorbed target compounds attach to the carbon first. However, higher-affinity background organics eventually enter the bed. These stronger molecules aggressively push the weaker compounds out of the pores. This phenomenon, known as chromatographic peaking, causes sudden, massive spikes of the target contaminant in your effluent. You must account for background organics during your initial capacity calculations.
Reliable breakthrough management requires a highly synchronized approach. You must align your predictive mathematical models with robust field detection hardware. Flow meters and theoretical isotherms provide the timeline, while continuous sensors and interstage sampling provide the physical validation. Furthermore, your media specifications dictate how the entire system behaves under stress. Matching the right pore structure to your specific contaminant profile ensures a manageable, predictable exhaustion cycle.
As a next step, we strongly recommend running a pilot-scale column test. An accelerated laboratory isotherm test using your site-specific fluid provides invaluable baseline data. It reveals exactly how competitive adsorption impacts your specific fluid mixture.
Stop relying on generic assumptions. Contact a technical specialist today to evaluate your unique flow parameters. They will help you specify the exact Water Treatment Carbon, PSD-A1 Coconut GAC, or LAC-P Granular Carbon required to optimize your change-out cycles and secure your process compliance.
A: Breakthrough capacity represents the usable limit of the bed before regulatory compliance failure occurs. It marks the moment contaminants first reach detectable limits in the effluent. Total capacity is the absolute chemical saturation point where the carbon can no longer adsorb anything, and influent equals effluent. Operators must replace beds based on breakthrough capacity, not total capacity.
A: A longer Empty Bed Contact Time (EBCT) gives molecules more time to diffuse into the carbon pores. This slower velocity generally compresses the Mass Transfer Zone (MTZ) relative to the overall bed depth. Consequently, a longer EBCT leads to a much sharper breakthrough curve and significantly higher overall carbon utilization before replacement is needed.
A: No, you should view models with skepticism. Mathematical isotherms provide critical baseline data. However, real-world influent concentrations fluctuate constantly. Temperature shifts and flow surges invalidate static models. You must combine predictive math with physical field detection—like effluent sampling or inline sensors—to accurately validate your models and prevent unexpected compliance failures.
A: Premature failure typically stems from three major field variables. First, competitive adsorption allows background organics to consume intended pore capacity. Second, channeling allows fluid to physically bypass the media due to poor distribution. Finally, kinetic limitations caused by insufficient contact time prevent the active adsorption zone from functioning efficiently.


